MARCH 15, 2024 PRESS RELEASE BY DUBLIN PRISON SOLIDARITY COALITION

March 15, 2024

For Immediate Release

Federal Judge Orders Appointment of Special Master to Oversee FCI Dublin, Prison where Sexual Assault Against Incarcerated People Runs Rampant

[Content warning: this press release mentions SA, r*pe]

OAKLAND, California – In a critical decision that condemns Federal Corrections Institute (FCI) Dublin as a “dysfunctional mess,” Federal Judge Yvonne Gonzalez Rogers ordered the unprecedented appointment of a special master to oversee the facility, where dozens of incarcerated people have survived sexual assault, rape, extreme retaliation, threats of deportation, medical neglect and a host of other forms of violence at the hands of Bureau of Prison officials for decades. The order also grants plaintiffs’ motion for class certification, making every incarcerated person held at FCI Dublin – including anyone sent there from now on – part of the class. Judge Gonzalez Rogers made it clear that she considers there are still serious concerns with FCI Dublin, including ongoing sexual abuse, retaliation, and inadequate medical and mental care. The lawsuit was filed by survivors of sexual assault at FCI Dublin and the California Coalition for Women Prisoners (CCWP), who are represented by Rights Behind Bars (RBB), the California Collaborative for Immigrant Justice and Rosen Bien Galvan & Grunfeld LLP (RBGG).

“We are encouraged that the court has taken the systemic issues at FCI Dublin seriously and ordered relief,” said Amaris Montes, attorney at Rights Behind Bars representing the plaintiffs, “There’s never been a facility like FCI Dublin, that’s why this first of its kind relief is necessary but only the first step to bringing justice for survivors. The only way to truly protect people is to bring them home.” 

“This unprecedented decision on the need for oversight shows that courageous incarcerated people, community and dedicated lawyers can collectively challenge the impunity of the federal government and Bureau of Prisons,” said Emily Shapiro, a member of California Coalition for Women Prisoners. “We need to bring people home where they can heal, receive reliable healthcare, get away from the mold and asbestos in the prison, and be free from abusers.”

The order states that “without injunctive relief, plaintiffs will face ongoing retaliation, including internal transfer to the SHU or external transfer to an outside facility, for filing allegations of sexual abuse” and that staffing shortages mean that “plaintiffs risk imminent and serious medical injury, including lack of treatment for serious medical ailments, psychological distress, and risk of suicide,” and that “the situation can no longer be tolerated.”

The exact timeline for the appointment of the special master and the scope of their access and responsibilities is yet to be determined, but another hearing has been scheduled for March 27, 2024.

Media Contacts:

Courtney Hanson, California Coalition for Women Prisoners, 916-316-0625, courtney[@]womenprisoners.org

Alex Mensing, California Collaborative for Immigrant Justice, 415.684.5463, alex[@]ccijustice.org

Another Dublin Women’s Prison Officer Sentenced for Sexual Abuse

kqed.org

By: Sydney Johnson

Mar 27, 2024

Allegations of sexual abuse at FCI Dublin go back decades, and the most recent scandals began unraveling in 2021 after an investigation by The Associated Press revealed a culture of abuse and cover-up at the facility. The former warden, chaplain and multiple other officers have been charged and sentenced, but allegations of abuse have continued.

FCI Dublin is currently facing 63 individual lawsuits over sexual misconduct and retaliation by officers, including 12 filed this year. A separate class-action lawsuit was filed by eight women incarcerated at FCI Dublin, alleging women at the prison were subject to rampant and ongoing sexual abuse, including rape and sexual assault, drugging, groping and being forced to take explicit photos.

It also claims women incarcerated at the facility were subject to abuse during medical exams and that immigrants were threatened with deportation if they did not comply.

Nunley, who is from Fairfield, served in the U.S. Air Force before working for the Bureau of Prisons. In July 2023, he pleaded guilty to sexually abusing five women who were serving prison sentences while he was a supervisor for inmates working at a call center called UNICOR.

The call center was a desirable place to work because it paid more than other jobs at the facility and women could gain transferable work skills, Molly Priedeman, assistant United States attorney who is prosecuting the case, said in court on Wednesday. She said the guard took advantage of his position and threatened women with firing and other punishment if they didn’t comply with sex acts.

“He held his victims’ jobs, their livelihood within the prison walls within his hands, and he used that power to harass, degrade his numerous victims,” Priedeman said. “This is not just a case where there are implicit power dynamics at play. … A number of his victims have described nightmares, suicidal thoughts.”

In his plea deal, Nunley admitted that he lied to federal investigators about sexually abusing his victims and about sending one of his victims sexually explicit notes. When confronted about his behavior, Nunley threatened to transfer one woman who was incarcerated at the prison to another facility and that she could lose her job.

At Wednesday’s court hearing in Oakland, women currently incarcerated at FCI Dublin testified about their experiences with Nunley. One inmate said that Nunley promoted her in the call center “because he told me he liked the way I looked” and that he repeatedly sexually assaulted her in his office.

“I felt uncomfortable and embarrassed,” the woman testified on Wednesday over a phone call. “Mr. Nunley became more and more aggressive with me after this incident. I felt scared. I didn’t know what he would do next.”

Another woman who was formerly incarcerated at the prison shared that Nunley left her a dozen sexually explicit notes and raped her after a shift at the call center. When she reported the notes and behavior, she said an officer laughed to the point of tears. After Nunley admitted to the acts, she received compassionate release.

Several family members testified in support of Nunley in the courtroom on Wednesday. “I understand and accept the allegations made against my husband,” said Samantha Nunley, the defendant’s wife. “I do not think that these actions define him as a person.”

Nunley himself addressed the judge and women who had testified in person on Wednesday, sharing that he has been active in therapy and a treatment program for sexual offenders.

“I stand here today in a place I never thought I would be, but I know that it is my own actions that brought me to this place. I want to first and foremost apologize to the women that I violated at FCI Dublin,” he said. “I’m really sorry I didn’t fulfill that promise I wanted to fulfill for them. I’m so sorry to all of those who were affected by my actions.”

Despite several convictions already, the situation at FCI Dublin has continued to spiral, and more reports of retaliation have come forward throughout criminal proceedings.

It is so dire at the facility that Judge Gonzalez Rogers earlier this month approved a request to appoint a special master to oversee mandatory changes to address sexual abuse and retaliation at FCI Dublin, a first in Bureau of Prisons history.

Attorneys for plaintiffs and defendants have since submitted their proposals for the special master, which the judge will select in the coming weeks.

The judge’s decision about the special master came less than a week after an FBI raid at the facility. The prison’s warden — the third to step in since an earlier warden was charged with sexual abuse at the prison — and three other top officials were abruptly replaced.

“The situation can no longer be tolerated. The facility is in dire need of immediate change,” she wrote in her order. “The court finds the Bureau of Prisons (“BOP”) has proceeded sluggishly with intentional disregard of the inmates’ constitutional rights despite being fully apprised of the situation for years. The repeated installation of BOP leadership who fail to grasp and address the situation strains credulity. The court is compelled to intercede.”

Infamous East Bay Women’s Prison Hit With 12 Additional Sexual Assault Lawsuits

A federal East Bay women’s prison where multiple staff have been charged with sexual abuse is now facing 12 additional lawsuits over misconduct at the facility.

The deluge of claims filed Thursday brings the total number of lawsuits facing the Federal Correctional Institution in Dublin to 63. It arrives on top of a major class-action lawsuit against ongoing abuse and retaliation at the prison and demands for changes at the facility, which is still under review by a federal judge.

Read the full story here. 


California Law Enforcement Agencies Are Spending More But Solving Fewer Crimes

Center on Juvenile and Criminal Justice

Published: Feb 13, 2024

Author: Mike Males, Ph.D.

A new report finds that, despite record spending on law enforcement, crime-solving is at record lows. Read on for the full report and download the Executive Summary here. 

Introduction

California is not ​defunding the police” nor implementing lenient criminal justice reforms – just the opposite. State spending on law enforcement has risen sharply, even after adjustments for inflation and population growth. The odds of being imprisoned per arrest have risen to near-record heights. However, despite record spending on California law enforcement agencies1 in recent years, one of the core measures of law enforcement effectiveness— crime clearance rates — has fallen to historically low levels. An agency’s clearance rate is the share of Part I violent and property crimes2 that are considered solved after law enforcement makes an arrest. Over the past three decades, these clearance rates fell by 41%, from a 22.3% clearance rate in 1990 to 13.2% in 2022, which equates to fewer than one in seven crimes solved (Figure 1, Table 1). California’s decline in overall clearance rates has been driven by falling property felony clearances (-59%), though the solve rate for violent felonies also fell during the 1990 – 2022 period (-14%).

This steep decline in crime-solving has occurred despite ballooning law enforcement budgets. From 1990 to 2022, Californians’ per-capita spending on law enforcement rose by 52% in constant, inflation-adjusted dollars to a total of roughly $25.5 billion (Figure 1, Table 1).3 California’s police are hardly being ​defunded;” rather, they are receiving record high per-capita funding.

crime stats chart

Are law enforcement agencies effective at solving crime? This analysis of major changes in the percentage of offenses cleared by the arrest of a suspect over the last 33 years finds surprising results:

  • Despite steep declines in crime and major per capita spending increases, law enforcement now solves fewer than one in seven serious crimes, a 41% decrease in solving crimes over the last 33 years. In 1990, law enforcement agencies cleared 439,000 Part I violent and property felonies (22.3% of reported Part I crimes); in 2022, just 144,000 (13.2% of reported Part I crimes).
  • Since 1990, clearance rates have plummeted for rape, aggravated assault, burglary, motor vehicle theft, and larceny/​theft offenses. During this period, clearance rates rose by 16% for robbery and by 1% for homicide (Figure 2).
  • Crime clearance rates vary widely by county and city, suggesting that local approaches to crime solving are more important than state laws or prosecution practices in determining whether persons are held accountable for crime. Additionally, some law enforcement officials express frustration with major retailers allegedly not cooperating with anti-theft efforts (Sacramento Bee, 2023).
  • California is now more likely to imprison someone arrested by law enforcement. The rate of imprisonment per cleared (solved) violent and property felony has risen by 207% since 1990. However, due to the declining property crime clearance rate, total imprisonments for property crime have fallen substantially. While reforms also lowered imprisonment rates, law enforcement’s low clearance rates, not reforms or purported prosecutor and court leniency, explain this decline.
  • Clearance rates had already fallen substantially prior to the start of California’s criminal justice reform era in 2011 (see Method).

Results

  • Police solved just 13.2% of Part I felonies in 2022, a decline from 22.3% in 1990

Police cleared (made an arrest to solve) 13.2% of all Part I offenses reported to them in 2021, including 41.0% of violent offenses and 7.2% of property offenses (Table 1). Much of this shift was driven by property offense clearances, which have fallen steadily and sharply (16.1% in 1990 – 9413.8% in 2010 – 14; falling to 7.2% in 2022). Declining property crime clearances are due to substantial reductions in clearances for larceny/​theft (-66%), vehicle theft (-29%), and burglary (-22%). These trends long predate the criminal justice reform era, which began in 2011

Clearance rates for violent offenses have fallen more moderately than those for property crime, from an average of 46.4% in 1990 – 94 to 41.0% in 2022. The homicide clearance rate has stayed steady while robbery clearances have risen; rape and assault clearances have fallen sharply during this period.

  • Reported crime has fallen steeply, leaving far fewer crimes for police departments to solve

One might think the decline in rape, assault, and property offense clearances would be due to rising reports of these offenses overwhelming police resources, but the opposite is the case (Table 2). Reports of all major offenses have plummeted by 57% since 1990 – 94 and by 21% since 200509. This shows other factors must explain law enforcement’s increasing inability to solve crime. More crime and lack of police resources cannot explain this trend.

Nor is law enforcement concentrating on other offenses. Arrests for drug, public order, misdemeanor, status, and all other non-Part I offenses fell from 1,621,712 in 1990 to just 624,455 in 2022, a 61% decline. Reported cases are not available for these offenses, so no clearance rates can be calculated.

  • Clearance rates have fallen despite rising law enforcement budgets

Law enforcement agencies are not being hampered by decreased funding and personnel. In fact, law enforcement agencies currently have larger budgets and staffing (even after factoring in inflation and California’s population growth) but solve fewer crimes than in the past. As Table 3 shows, per-capita spending on law enforcement (adjusted for inflation) rose by 46% from the early 1990s through 2022. Yet, during this period, the percentage of reported Part I offenses cleared by an arrest fell by 38%. These trends cast doubt on whether increasing police budgets and staffing would solve more crime.

  • Declining law enforcement crime-solving, not reforms or DAs, are leaving fewer crimes resolved

The upshot is that law enforcement agencies are presenting prosecutors and community programs with far fewer people to process today than in the past. In 1990 – 94, police agencies cleared an average of around 423,000 Part I offenses per year, including 152,000 violent and 270,000 property offenses. In 2022 — in a state with 10 million more people and 45,000 more law enforcement personnel — police agencies cleared just 144,000 Part I offenses, including 79,000 violent and 65,000 property offenses. These declines in crime and crime-solving are the principal contributors to the massive declines in court, prosecutor, and probation caseloads, as well as sizable cuts in prison and jail populations.

  • Clearance rates vary widely by jurisdiction, with no clear relationship to county crime rates

California’s 58 counties, each with multiple law enforcement agencies, have widely varying crime clearance rates. California cities, even large ones, and unincorporated areas vary even more widely. Among California’s major urban counties, Part I offense clearance rates in 2022 ranged from a high of 26.0% in Tulare County, 21.5% in Sonoma County, and 19.9% in San Bernardino County to a low of 6.7% in San Francisco and 5.8% in Alameda County, the latter driven by the Oakland Police Department’s very low clearance rate (1.5% in 2022 for all Part I offenses, including just 6.5% of violent offenses). 

Law enforcement agencies need to explain why crime clearances have been falling since 1990 despite police agencies being given more resources and personnel. If, as is widely speculated, officers secretly stopped making arrests to protest reforms and coerce public sentiment against ​liberal” policies, that would be a criminal dereliction of the police duty and oath that demands disciplinary action. The lawful way for police to protest policy is not to shirk their duties, but to make their case in policy forums or by running for office, like all other community members. Alternatively, if law enforcement has become less competent in solving crimes despite receiving more money and personnel, or if for some reason crimes have become harder to solve, these matters also require scrutiny so that corrective actions can be taken. 

  • The odds of imprisonment per cleared case have increased, not decreased, over the last 35+ years

The impression, often fostered by anti-reform lobbies, that individuals are ​getting away with crime,” fails to account for the large drop in people who are arrested for reported Part I offenses. It is a myth that criminal justice reforms render a person arrested for a Part I offense less likely to be incarcerated for that offense than in years past (see Rodriguez, 2021). The opposite is true. In fact, a Part I offense cleared by arrest is more likely to result in a prison admission today than it has for any of the past 36 years, excepting 2009 and 2010

In 2010, just prior to the start of the criminal justice reform era, there were 36,067 prison admissions for violent and property offenses, a rate of 17.1 prison admissions per 100 cleared Part I offenses (Figure 3). This rate is more than double 1990’s when 439,065 total Part I offenses were cleared by arrest and 28,122 people were admitted to prison for violent and property offenses, equal to 6.4 prison admissions per 100 cleared Part I offenses (Figure 2). In 2021 and 2022, there were more than 14 violent and property prison admissions per 100 cleared Part I offense, more than double 1990’s rate. 

These trends complicate California’s progress towards remedying unconstitutional and inhumane prison overcrowding. While it is true that reduced law enforcement clearance rates aid in reducing prison populations, reducing prison populations should be accomplished by targeted policy, not by the haphazard failure to make arrests. The proper way to reduce prison populations is via legislated reforms such as Public Safety Realignment (AB 109), which, beginning in 2011, successfully reduced prison admissions for non-violent and non-serious offenses to comply with these court mandates. In 2020COVID-19 restrictions brought steep but short-lived reductions in prison admissions, followed by a sharp reversal in 2021.

  • Declining clearance rates, not reforms, drove down new prison admissions for property offenses

Opponents have criticized Proposition 47, as well as ​liberal” prosecutors, as too lenient towards people who have committed serious property offenses (Washburn, 2022). However, police clearance data suggest that this blame is misplaced. In fact, while prison admissions for property offenses did fall by 24% from 2014 (just before Proposition 47 took effect) to 2022, much of the responsibility for this decline lies with police departments whose felony property crime clearance rates fell even faster (by 50%) during the period. In fact, the likelihood of prison admissions per cleared property offense rose by 13% from 2014 to 2019, the latest year before COVID-19 restrictions temporarily reduced new prison admissions. Imprisonment rates per property offense rebounded in 2022 to levels 26% higher than 2014.

  • Property offense clearances were falling long before the justice reform era

Law enforcement clearances for property crimes did not decline because the California legislature raised the felony limit for thefts from $400 to $950 in 2010 (see Method).4Three-fourths of California’s law enforcement jurisdictions had declines in clearances of property offenses from 1990 to 2010, prior to the post-2010 reforms (DOJ2022). Moreover, from 2010 to 2019, dozens of the state’s 258 major law enforcement agencies (those with 500 or more reported Part I property offenses every year) reported increased property offense clearances. These cities include Berkeley, Eureka, Porterville, Santa Cruz, and Walnut Creek. Cities with thousands of reported property crimes each year increased their property offense clearance rates (often substantially) under the reformed felony theft limits.

Conclusion

California’s criminal justice debaters are arguing over the wrong things. Anti-reform lobbies, police officials and unions, and many press reports wrongly criticize criminal justice reforms and progressive district attorneys for failing to hold people accountable for crime. In part, the rapid rise in law enforcement budgets is the result of lobbying efforts by police unions and advocacy groups. These groups have been able to vastly expand the share of public funds allocated to law enforcement agencies. Yet, even with substantial increases in police funding, California has failed to see a return on its investment. 

In stark contrast to California’s $25.5 billion annual investment in law enforcement, many community programs are addressing the root causes of crime and violence at a fraction of the cost. For example, evaluations of Proposition 47’s behavioral health, housing, and employment programs, which receive roughly 1/​200th as much funding as law enforcement each year, show strong returns on a relatively modest investment. Participants of Proposition 47-funded services see lower rates of recidivism and homelessness and higher rates of employment after completing the program (Washburn, 2022).

True reform requires targeted strategies like these that address people’s underlying needs through housing support, education, mental health services, drug treatment, and more. Heavily investing in police is not working. Instead, jurisdictions should explore alternatives to policing for those problems other community organizations and agencies are better positioned to address.

Method

For each of the seven major Part I offenses (four violent and three property) used to form an ​index” of crime, police report how many offenses are cleared (solved) by the arrest of a suspect. Crime clearances approximate but do not equal arrests, since one arrest may clear several offenses, or several arrests may clear just one, and later investigation may change initially reported clearances. 

Clearance rates are an imperfect indication of the percentage of crimes that police ​solve.” A crime is considered cleared by law enforcement if an arrest was made. An adjudication of guilt by a court is not necessary for a crime to be considered cleared. Occasionally, a law enforcement agency will designate a crime as cleared by ​exceptional means” without an arrest, for instance, if a suspect was identified but died before an arrest could be made.

Since 1872, state law has contained protections against warrantless arrests for misdemeanors unless the misdemeanor was committed in the presence of the arresting officer. Police can address suspected misdemeanor law violations by reporting the incident to prosecutors. (This is called an ​application for a complaint.”) But long-standing law that protects citizens from warrantless misdemeanor arrests unless they committed a crime in the presence of someone authorized to make an arrest – combined with defining clearances primarily by arrest – means that clearance rates for some misdemeanors will be low.

California’s broad protections against warrantless misdemeanor arrests are as old as the state itself, but the definition of some property crimes has had to change due to inflation. In 1982, the legislature decided that thefts of items valued at $400 or more ($1,260 in today’s dollars) should be considered a felony. That $400 threshold stood for a generation. In 2011, the California Legislature changed the threshold for Grand Theft from $400 to $950 to account for inflation. As a result, thefts of items valued from $400-$949 became misdemeanors; this change affected clearance rates for whatever share of thefts were of items valued in that range. These changes in law – intended to keep punishments up to date with inflation – likely affected clearance rates for thefts of items valued between $400 and $949. The full impact of these changes on clearance rates should be observable at the dates of their implementation: some of the change between 2011 and 2012, for instance, is likely due to the update in law. Outside of these years, changes in clearance rates are entirely due to changes in police practices or police data reporting.

Within the years affected by changes in law, it is not possible to determine the major drivers of changes in clearance rates because law enforcement agencies in the state declined to update their data definitions to match existing law. Police still use the $400 threshold and have declined to update their reporting to match California’s laws since 1982.

In 2022, crime clearance rates were reported by 718 law enforcement agencies to the California Department of Justice (DOJ) (2023). DOJ releases these data publicly, allowing for an analysis of crime solving by local police, county sheriffs, specialized agencies such as transportation, park, campus, and other police, and state police agencies like the California Highway Patrol. Summing clearances produces totals for all 58 counties and a statewide clearance rate.

A clearance rate analysis is only as accurate as the data used to produce it. These data, like crime statistics more broadly, are produced by police agencies themselves and subject to reporting errors and, in some cases, distortion. A charting of clearance rates for 1985 – 2022 for the state’s five largest cities, which should have the most stable numbers, instead reveals extremely erratic patterns. In Sacramento and San Jose, violent crime clearance rates varied by 30 points over a period of one year, while variations of 10 points or more in a one-year period occurred for Los Angeles, San Diego, and San Francisco. Property crime clearance rates also proved unstable. It may be that law enforcement agencies are not capable of generating reliable crime statistics, indicating their gathering and reporting should be shifted to another public agency.

Reported offenses and clearances by jurisdiction are available for the 1985 – 2022 period (DOJ2023). This report uses post-1990 numbers. Populations for each incorporated jurisdiction for 2020 are from California Department of Finance (2023) estimates, which allow calculation of offense rates. Results are reported for each county, selected cities and unincorporated areas, and cities of 100,000 population or more.

References

Bureau of State and Community Corrections (BSCC). (2023). Jail profile survey. Juvenile detention profile survey. At: http://​www​.bscc​.ca​.gov/​m​_​datar….

California Highway Patrol, Department of (CHP) (2023). Ebudget. At: https://​ebud​get​.ca​.gov/​2023
24/pdf/GovernorsBudget/2500/2720.pdf

California Office of the Controller (Controller) (2023). City data. At: https://​cities​.bythenum​bers​.sc…. County data. At:
https://counties.bythenumbers.…. Budgetary/​Legal Basis Annual Report. At: https://​www​.sco​.ca​.gov/​a​r​d_sta….

California Department of Corrections (CDCR). (2023). Offender data points. At https://​www​.cdcr​.ca​.gov/​r​esear…. California Prisoners and Parolees. At: https://​www​.cdcr​.ca​.gov/​r​esear…. Special data provision by request for 20202021, and 2022.

California Department of Finance (DOF). (2023). Demographic Research Unit. Estimates. At: https://​dof​.ca​.gov/​f​o​r​e​c​a​sting….

California Department of Industrial Relations (DIR). (2023). California Consumer Price Index, (19552022). At: https://​www​.dir​.ca​.gov/​O​P​RL/CP.

California Department of Justice (DOJ). (2023). Crime in California, 1985 – 2022. At: https://​open​jus​tice​.doj​.ca​.gov…https://​open​jus​tice​.doj​.ca​.gov….

California Senate Committee on Public Safety (2010). AB 2372 Bill Analysis, June 292010www​.legin​fo​.ca​.gov/​p​ub/09 – 10/​b…https://​legin​fo​.leg​is​la​ture​.ca….

Pew Charitable Trusts. (2017). The effects of changing felony theft thresholds. At: https://www.pewtrusts.org/~/me…
.
Prison Policy Initiative. (2020). How inflation makes your state’s criminal justice system harsher today than it was yesterday. At: https://​www​.pris​on​pol​i​cy​.org/b….

Public Policy Institute of California (PPIC). (2020). How much do cities spend on policing? At: https://​www​.ppic​.org/​b​l​o​g​/how-….

Rodriguez, S. (2022). What compels Republicans and police to lie about Proposition 47? Orange County Register, February 182022. At: https://​www​.ocre​g​is​ter​.com/202about-proposition-47.

Sacramento Bee (12 Nov 2023). Sacramento County sheriff accuses major retail stores of stymieing efforts to stop theft. At: https://​www​.sacbee​.com/​n​e​ws/lo…

Washburn, M. (2022). Proposition 47: A $600 million lifeline to California communities. Center on Juvenile and Criminal Justice. At: http://​www​.cjcj​.org/​u​p​l​o​a​ds/cj…es.pdf.

Please note: Jurisdictions submit their data to the official state or nationwide databases maintained by appointed governmental bodies. While every effort is made to review data for accuracy and to correct information upon revision, CJCJ cannot be responsible for data reporting errors made at the county, state, or national level.

Media Coverage & Response

We are pleased with the response to our most recent report California Law Enforcement Agencies Are Spending More But Solving Fewer Crimes. Media and partner coverage underscores the urgency of this information and the questions the data poses. 

Contact: For more information about this topic or to schedule an interview, please contact CJCJ Communications at (4156215661 x. 103 or cjcjmedia@​cjcj.​org.

  • 1 This includes the California Highway Patrol, county sheriff’s departments, and local police agencies. 
  • 2 Part I felonies include murder, rape, aggravated assault, robbery, burglary, motor vehicle theft, and larceny/theft. Larceny/theft is the only Part I offense to include misdemeanors (see Method). 
  • 3 Law enforcement agency budgets are in constant 2022 dollars adjusted for inflation and state population growth. 
  • 4 Note: Even with a narrower definition of felony theft, California is not lenient; it has the country’s 11th strictest threshold for felony theft among the 51 states and DC (Prison Policy Initiative, 2022). California is not staking out a radical position; it merely joined the large majority (37) of states that raised their felony theft thresholds from 2000 to 2016 to higher levels (Pew, 2017). Raising the grand theft threshold from $400 to $950 only partially compensated for the effects of four decades of inflation in artificially expanding felony offenses. An item worth $950 whose theft would be a felony in 2021 would have been worth less than $400 prior to 1982 resulting in only petty theft charges for stealing that same item back then. As a result, inflation had boosted the proportion of larceny/thefts classed as felonies from 27% in 1990 to 41% in 2014. Felonies should only be expanded by direct legislative action, not by the passive effects of non-legislative forces such as inflation. 

Zombie politics: The return of failed criminal legal system policies in 2023 – and how to fight back

Prison Policy Initiative

January 24, 2024

by Sarah Staudt

For the first time in over a decade, prison and jail populations increased in 2022, and state prison systems and the federal Bureau of Prisons are predicting future growth. Although there are many reasons for this – including courts returning to normal operations after the height of the pandemic – at least some of this expected rise will be the direct result of regressive policy choices made by state legislatures.

The politics we have seen surrounding crime and punishment are eerily reminiscent of 1990s “tough on crime” rhetoric: in Florida, Governor Ron DeSantis suggested that his political opponents are “pro-crime,” throughout the country; while Democrats attacked parole reform, reform-minded prosecutors, and bail reform in their 2022 mid-term election challenges. This rhetoric contradicts the facts: crime across the nation remains at record low levels, including a likely dramatic decrease in violent crime in 2023.

crime rates 2018 - 2023 bar graft

As our partner organizations around the country decry this resurrection of bad policy, we looked at recent legislation passed around the country to identify trends in this most recent crop of throwback laws. In this briefing, we present some of the most common kinds of tough-on-crime laws passed in 2023  and the best arguments against them, so that advocates can be ready if these trends appear in their state.

Renewing the War on Drugs

In recent years, substantial progress has been made to address and begin to reverse the harmful policies from the War on Drugs. The authors of these policies, passed between the 1970s and 2010s, created draconian mandatory minimum sentencing laws, established a racist sentencing disparity between crack and powder cocaine, and led to the incarceration of millions of people. Despite spending billions each year to enforce these policies, the drug war has not reduced drug use rates, drug prices have dropped, and overdose deaths have risen. Based on our experience with the Drug War, there is no reason to think that arrest and incarceration can stop drug use or trade.

Fentanyl now permeates the United States drug market, leading to higher risks of overdose. Experts and advocates consistently urge a public health approach to fentanyl, but, unfortunately, too many states are treating it as “Crack 2.0“, pursuing the same failed policies that sent millions of people to prison. This includes penalty enhancements for both possession and distribution of fentanyl and increased penalties for homicide charges leveled against people who provide drugs to a person who subsequently dies of an accidental overdose – often called “drug-induced homicide” laws. These laws are often levied against people using drugs together, who may or may not know that fentanyl is present in what they are using.

This year, a number of states passed laws resurrecting failed war on drugs policies:

  • Alabama (HB 1) created mandatory minimums for possession of fentanyl. This bill was especially concerning because it passed the legislature unanimously, suggesting that there was no meaningful debate about whether the policy would be effective.
  • Iowa (HB 595) increased penalties for both possession and distribution of fentanyl.
  • Wisconsin (AB 68) increased penalties to 60 years for reckless homicide involving delivering fatal drugs. The law would apply to people using drugs together.

Arizona and the federal government have also come close to passing retrograde drug legislation. Arizona’s legislature passed a presumptive 10 year mandatory minimum sentence for possession of as little as 2 milligrams of fentanyl; that bill was vetoed by the governor. At the federal level, the HALT Act would trigger new and increased mandatory minimum sentences for fentanyl; it has passed the House and currently sits in the Senate.

Fighting back against zombie drug policies

Advocates facing regressive drug policy changes have the benefit of decades of research showing that these policies do not work, have never worked, and cause massive harm to communities.

First, advocates can rely on the mountain of evidence showing mandatory minimums and longer prison terms do not reduce crime, drug use, or overdoses. Families Against Mandatory Minimums has compiled a wealth of resources on sentencing reform, including a handy guide to arguments against mandatory minimums. They argue that mandatory minimums create racially biased outcomes – Black people are 65% more likely to face mandatory minimum charges. Advocates can also point to the ways that lengthening prison sentences will expand prison populations in the long run.

Second, advocates can educate lawmakers on how carceral approaches fail to address the fentanyl crisis. In particular, many lawmakers believe that jails and prisons will provide treatment for opioid users – in fact, incarceration increases overdose risk, and few people receive treatment inside. Policymakers also believe they can target drug dealers with harsh penalties without harming people who use drugs. In fact, drug users and drug suppliers are most often the same people; sentencing enhancements are unlikely to affect so-called drug “kingpins” and will more likely target users and low-level sellers. Drug Policy Alliance has a great video on this subject.

Lastly, advocates can provide lawmakers with alternatives to these carceral policies. Kneejerk penalty increases are often the product of a desire to “do something” about the very real devastation that fentanyl and overdoses are wreaking in communities across the country. But doing things differently during this overdose crisis means taking a public health approach to drug use. Drug Policy Alliance has created a comprehensive toolkit on such health-centered approaches, including increasing access to treatment and harm reduction approaches like safe consumption sites and fentanyl test strips.

Criminalizing the homeless

The United States has a long history of responding to the problem of homelessness with criminalization and punishment. Homelessness has risen in recent years, driven by economic factors like increased housing costs, as well as by the COVID-19 pandemic.

As concern about homelessness rises, some jurisdictions are trying to criminalize their way out of a problem that can only be addressed with social services and housing.

  • In Georgia (SB 62), the state legislature passed a law requiring that municipalities enforce anti-camping laws.
  • Alabama (HB 24) expanded the definition of loitering to encompass more unhoused people.

Arizona also came disturbingly close to passing similar policies. A vetoed bill in Arizona (SB 1024) would have created an anti-camping law, and two other bills proposed further criminalized homeless encampments but failed.

There are dozens of ways that policymakers have targeted people experiencing homelessness. In 2021, the National Homelessness Law Center published a guide to laws around the country criminalizing homelessness; they note that as of 2021, almost every state has at least one law restricting behaviors associated with the experience of being homeless.

Protecting unhoused people from backwards policies

There’s no denying that rising housing insecurity is a genuine concern. Unfortunately, the solutions are complex, and can’t be solved by simply outlawing living outside. Advocates can help lawmakers understand the feedback loop between criminalizing homelessness and increasing mass incarceration. Further criminalizing homelessness is likely to increase jail populations – and jails are ill-equipped to address the poverty, mental health, and substance use related reasons why people are experiencing homelessness. The National Homeless Law Center’s comprehensive guide notes that criminalization harms the health and wellbeing of unhoused people, and is an extremely expensive reaction to homelessness. Incarcerating someone costs over $47,000 a year; a week in a jail cell might cost the equivalent of a month or more of housing.

Advocates can also help lawmakers find and implement successful, humane, and non-carceral approaches to this crisis. “Housing First” policies, which give people housing as the first step in holistically addressing their challenges, have been shown to interrupt cycles of criminalization and give people a path to long-term, stable housing. Housing First is part of a suite of innovative approaches to homelessness cataloged by the National Homelessness Law Center; other approaches include expanding access to affordable housing subsidies, embracing innovative housing solutions like “tiny home” communities, and preventing homelessness before it happens by reforming eviction laws and prohibiting discriminatory housing policies.

Lastly, the Homelessness Law Center notes that some policies criminalizing homelessness violate constitutional rights, and can be challenged in the courts. The Ninth Circuit has ruled that imposing criminal penalties for people who cannot obtain shelter violates the Eighth Amendment prohibition on cruel and unusual punishment. Sweeps of tent cities have been found to violate due process rights when governments destroy or confiscate personal property without notice. The courts may provide another avenue for protecting the basic human rights of people experiencing homelessness

Resurrecting failed sentencing policies

2023 saw a resurgence of so-called “Truth in Sentencing” laws. In the 1990s, federal legislation established funding incentives that encouraged states to pass laws requiring that people charged with certain offenses serve at least 85% of their sentences in prison. In the mid- to late 90s, 21 states passed these laws. These policies sometimes as much as doubled people’s actual prison terms overnight, as states that had historically allowed people access to parole after half or less of their sentences were suddenly requiring much more time in custody before parole. Notably, these sentencing structures reduce the ability of people to earn time off their sentences for good behavior or for completing programming, and therefore remove powerful incentives that support prison safety and reentry success. In 2022 and 2023:

  • Louisiana (HB 70) reduced the ability of people convicted of repeated non-violent offenses to earn time off their sentence for good behavior.
  • South Dakota (SB 146) eliminated parole eligibility for many offenses and reduced the ability to earn sentencing credit.
  • Arkansas (SB 495) changed sentence structures and made certain felonies ineligible for sentence credits.

In 2022, Tennessee’s SB 2248 served as a cautionary tale. Tennessee’s Department of Corrections projects that the resulting increases in incarceration will cost taxpayers at least $40 million over the next 8 years. Chillingly, when asked about these costs, the Speaker of the House simply said, “if we need to build more prisons, we can.”

The truth about “Truth in Sentencing”

Because Truth in Sentencing has been tried before, advocates have lots of resources showing that it is a failed and counterproductive policy. Research consistently shows no public safety benefit to increased incarceration, and that longer sentences do not deter crime. Research also shows that Truth in Sentencing reduces incentives for incarcerated people to complete rehabilitative programming, increases safety risks for people in prison and corrections officers, and increases recidivism. Truth in Sentencing leads directly to prison overcrowding, which causes immense suffering.

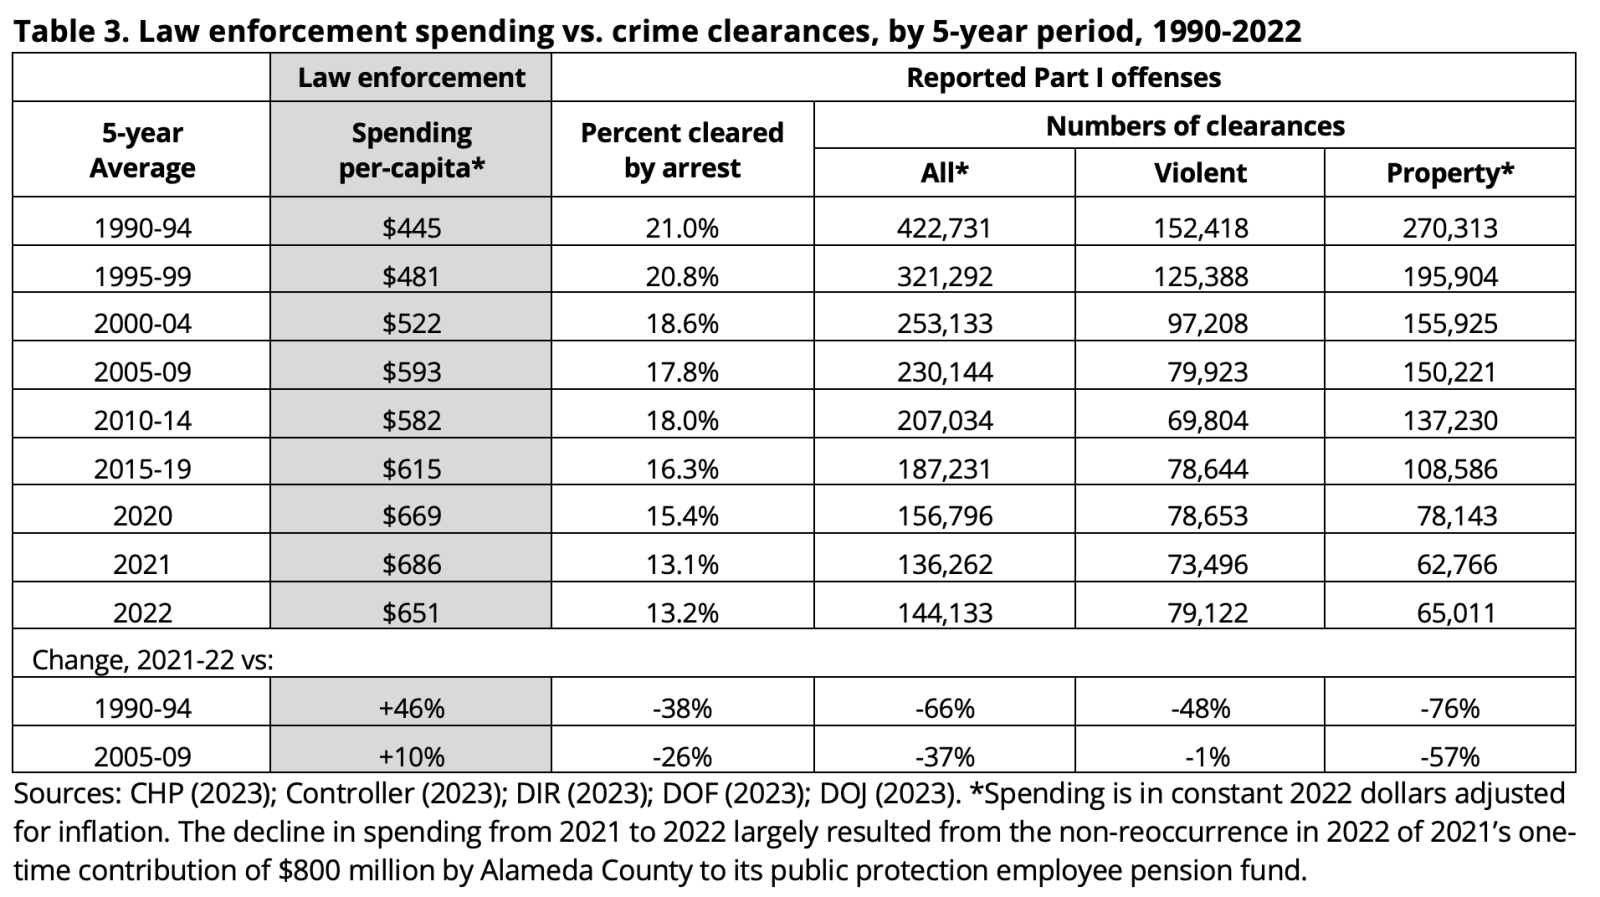
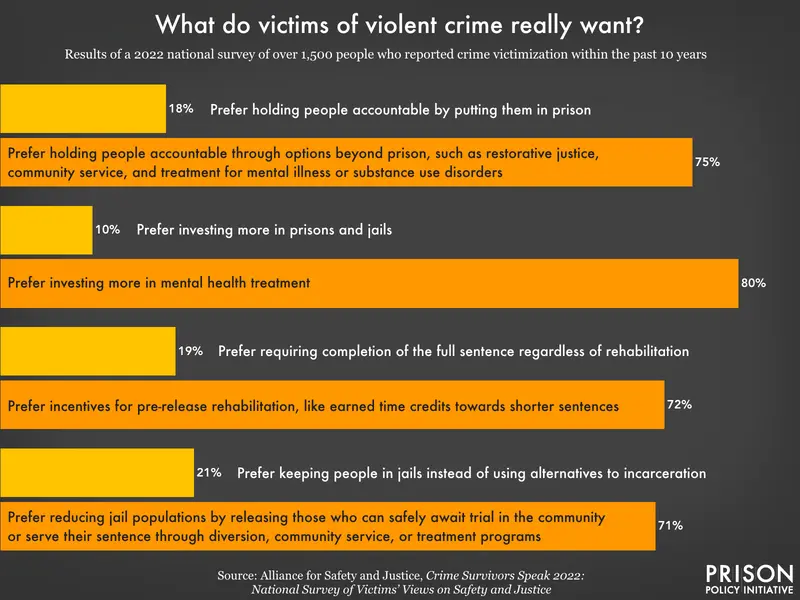
Truth in Sentencing and other “tough-on-crime” policies are often enacted in the name of crime victims. Advocates can help policymakers understand that most victims of violence prefer that money be spent on violence prevention, not incarceration.

Lastly, because of the immense expense of Truth in Sentencing policies, progressive advocates may find unlikely bedfellows in the fight against these laws. In Tennessee, the American Conservative Union opposed the Truth in Sentencing bill; voices on both sides of the aisle understand that investing in prisons is an ineffective, wasteful, and dangerous approach to public safety.

Building more prisons

States continue to invest hundreds of millions of dollars into building new prisons instead of pursuing decarceration strategies. These efforts often cite prison overcrowding or aging buildings to justify this immense expenditure – but fail to explore proven strategies to reduce the number of people behind bars. In 2023, states made major moves towards prison construction:

  • Arkansas (SB 495) appropriated $470 million for 3,000 new prison beds.
  • South Dakota (HB 1016) appropriated $60 million for a new women’s prison and $340 million for a new men’s state prison.
  • Montana (HB 817) appropriated $211 million for capital improvements at Montana state prisons.

Combatting prison construction

Demands for new or expanded prison construction are constant features of the criminal legal reform landscape. Often, these efforts are sold to lawmakers as either necessary or actually progressive, when in fact they are neither. Although it may be true that prison buildings are aging and that prisons are overcrowded, the most straightforward – and most cost-effective – approach to addressing these problems is decarceration. Substantially reducing prison populations can allow states to close decrepit buildings instead of spending millions renovating or rebuilding them. Around the country, states have successfully reduced their prison populations enough to close facilities; twenty-one states fully or partially closed prisons between 2000 and 2022.

Advocates arguing against prison construction can look to the detailed plans created by activists to close 10 prisons in California by 2025. They may also find the Prison Policy Initiative’s anti-jail expansion materials helpful – many of the arguments against building new jails also translate to the prison context. Even in states where active plans to build prisons are not on the table, advocates can argue for prison and jail construction moratoriums, which can give state policymakers time and space to genuinely pursue decarceral solutions, instead of investing in our failed mass incarceration system.

Undermining reform prosecutors

In recent years, many jurisdictions have elected reform-minded prosecutors (sometimes called “progressive prosecutors”) who are interested in changing the tough-on-crime policies behind mass incarceration. The American criminal legal system is designed to give substantial discretionary power to prosecutors, and prosecutors are increasingly using this discretion to roll back some of the most damaging parts of the system. These prosecutors have taken a range of approaches, from increasing access to diversion programs to creating conviction integrity units that examine the cases of incarcerated people asserting their innocence. Although some reform prosecutors have seen pushback from voters in recent years, most still enjoy widespread support.

Unfortunately, conservative state legislatures continue to try to undermine these democratically elected local officials with legislation designed to take their discretionary power away and force them to adhere to carceral policies – or risk being removed from office.

  • Florida Governor DeSantis has continued a trend of removing popular States Attorneys – including the state’s only Black woman state prosecutor – because of complaints about sentencing decisions and statements opposing his attacks on reproductive rights and gender-affirming health care.
  • In Georgia (HB 231), the state legislature created a “Prosecuting Attorneys Oversight Commission” empowered to investigate and remove local prosecutors.
  • In Texas (HB 17), the legislature passed a bill allowing courts to remove district attorneys for failing to pursue certain types of prosecutions.

Protecting local control of prosecutions

Advocates can help policymakers and the media understand that state legislative efforts like these undermine local elections and reduce confidence in the democratic process. Although rhetoric against reform prosecutors has been loud and sometimes extreme, it can be helpful to point to evidence that Americans are still broadly supportive of criminal legal system reform, and continue to support it at the polls. Reform prosecutor races are often high profile and hard-fought, and voters have made a clear and intentional choice to go against the status quo of harsh criminal legal system policies. Those choices should be respected.

Importantly, there is no evidence that crime has worsened under reform prosecutors. In fact, between 2015 and 2019, cities with reform prosecutors were less likely to experience a rise in homicides than those with traditional prosecutors.

Conclusion

We unfortunately couldn’t possibly cover all of the “zombie policies” cropping up around the country. Other notable examples include bills to enshrine cash bail more deeply in state law (Wisconsin), and expanding the use of non-unanimous jury verdicts for the death penalty (Florida), among many others. And by highlighting these setbacks, we don’t intend to diminish the real progress made around the country in 2023. Our Winnable Battles report details some of these successes; the Sentencing Project’s roundup of 2023 trends in criminal legal system reform highlights even more.

But the forces that seek to entrench and expand mass incarceration remain active across the country. We hope that this guide helps arm advocates with some of the arguments they need to avoid history repeating itself.


Footnotes

  1. For the sake of brevity, this piece considers only legislation that actually passed into law in 2023. This narrow focus is not meant to discount the ongoing fights going on around the country to protect reform efforts from repeal and fight back retrograde laws that were proposed but ultimately not passed. This focus is also not meant to diminish or ignore the real progress on criminal legal system reform that has been made around the country in 2023.  ↩

Sarah Staudt is the Policy and Advocacy Director at the Prison Policy Initiative. (Other articles | Full bio | Contact)